Aftermarket sales surge on aging vehicle demand
The U.S. Light-duty aftermarket will expand 5.2% in 2026, a surge fueled primarily by an aging vehicle fleet, according to the Auto Care Association and MEMA Aftermarket Suppliers. This isn't a blip; it's a structural reality where older cars demand increased spending on non-warranty parts and service labor. The 2026 Joint Channel Market Size and Forecast, prepared by S&P Global Market Intelligence, confirms that keeping existing vehicles operational is the single most potent economic driver for the sector today.
We need to look past the headline sales figures to understand the mechanics of this expansion. The aging vehicle fleet directly correlates to rising repair frequency, but the story goes deeper into the Joint Channel Forecast Model. This model integrates macroeconomic indicators and vehicle parc data to predict outcomes with precision, moving beyond simple unit counts. We also face rising repair complexity, driven by advanced driver assistance systems, which inflates the value of each service transaction even as consumers face broader economic uncertainty.
Strategic planning using this forecast data is no longer optional; it's survival gear for navigating geopolitical instability and supply chain fragility. While external pressures mount, the fundamental reliance on personal transportation ensures consistent mileage and steady demand. By understanding these growth drivers, stakeholders can position themselves within a market that prioritizes maintenance over replacement, securing revenue streams regardless of new vehicle sales fluctuations.
The Role of the Aging Vehicle Fleet in Market Expansion
Defining the U.S. Automotive Aftermarket and Non-Warranty Parts
Total United States light-duty aftermarket sales grew by a modest margin in 2024 to reach $413.7 billion. This valuation excludes warranty work, focusing strictly on consumer-driven maintenance and repair demands that sustain the sector. Non-warranty parts constitute the primary revenue driver, covering replacement components necessitated by wear rather than manufacturing defects. As cars remain operational longer, the aging vehicle fleet directly increases demand for non-warranty parts, fluids, and service labor.
Market trajectories indicate the industry will surpass $500 billion by 2029, extending post-pandemic growth patterns. However, physical inventory volume now competes with the speed of data access required to move stock efficiently. Legacy systems suffering from slow page loads are being replaced by composable architectures to eliminate digital latency in parts logistics. Speed and data access are becoming the primary products rather than just physical components. Operators relying on outdated update cycles face measurable competitive disadvantages against data-driven orchestration models. The definition of market health now includes the velocity of information flow alongside traditional sales volume metrics.
How Aging Fleets Drive Demand for Replacement Tires and Service Labor
Higher average vehicle age directly increases failure rates for wear items like replacement tires and complex service labor. Older units accumulate mileage that accelerates tread wear and sidewall degradation, pushing the replacement tire market value to a substantial sum in 2024. This specific segment growth outpaces general inflation as drivers prioritize safety over new vehicle acquisition. The causal link between fleet age and parts consumption remains the strongest predictor for sustained revenue in non-warranty categories.
Mechanical wear is not the only driver; electronic complexity creates a dependency on professional technicians. A documented decline in DIY repairs correlates with the rise of integrated software systems that require proprietary diagnostic tools.
Light-Duty Growth Rates Versus Total Auto Care Industry Projections
Light-duty segments project 5.2 per cent growth in 2026, trailing the broader industry's 5.4 per cent expansion rate slightly. This divergence highlights how heavy-duty and specialty sectors accelerate total market velocity beyond passenger car repair volumes alone. Light-duty units dominate absolute revenue, yet the total industry trajectory relies on commercial fleet maintenance and heavy equipment servicing to offset minor passenger vehicle slowdowns. Heavy-duty components and commercial services drive the differential, capturing value that pure passenger car metrics miss.
The $599.7 billion total sales forecast for 2026 indicates that nearly one-sixth of market value exists outside standard passenger vehicles. Ignoring this split leads to inventory misalignment where shops stock high-turnover consumer items while missing higher-margin commercial contracts. Strategic planning requires distinct procurement paths for these diverging growth curves.
Inside the Joint Channel Forecast Model and Growth Drivers
Macroeconomic Indicators and Vehicle Parc Data in the Joint Channel Forecast
The Joint Channel Forecast Model synthesizes macroeconomic indicators and vehicle parc data to generate market predictions. S&P Global Market Intelligence prepared the 2026 Joint Channel Market Size and Forecast using this dual-input architecture. Macroeconomic indicators provide the velocity vector for consumer spending power, while vehicle parc data establishes the absolute baseline of repairable units.
- Ingest national employment and inflation rates.
- Overlay total registered vehicle counts.
- Calculate parts demand per average unit.
Rising vehicle complexity acts as a force multiplier on this baseline data. The integration of advanced driver assistance systems drives a specific hardware expansion, with unit counts projected to jump from 361.4 million in 2026 to 582.6 million by 2033. This surge necessitates higher labor values per repair event, skewing revenue projections upward independent of fleet size growth.
| Input Layer | Function | Output Impact |
|---|---|---|
| Macro Indicators | Measures disposable income | Adjusts service frequency |
| Vehicle Parc | Counts active units | Sets total addressable market |
| Complexity Factor | Weighs tech density | Increases average repair cost |
A critical limitation exists in the latency of parc data updates; registration lags can obscure rapid shifts in vehicle retirement rates during economic downturns. Operators relying solely on aged parc figures may overestimate immediate parts demand if scrappage accelerates unexpectedly. The aging vehicle fleet remains the dominant variable, yet its predictive power diminishes if macroeconomic pressure forces premature vehicle replacement. This volume expansion forces shops to acquire calibrated sensors and proprietary diagnostic software, fundamentally altering the labor requirements for collision and electrical work. Rising vehicle complexity ensures that simple part swaps now mandate software initialization sequences previously unknown to general technicians.
| Feature | Traditional Repair | ADAS-Integrated Repair |
|---|---|---|
| Primary Input | Mechanical wear data | Sensor calibration logs |
| Tooling Cost | Low | High |
| Technician Skill | Mechanical aptitude | Software fluency |
Com/us-automotive-aftermarket-forecast-2026/) provides the baseline volume, yet electronic density dictates the revenue per repair order. Shops lacking updated toolchains face exclusion from high-value claims despite having physical capacity. This divergence creates a bifurcated market where technical capability outweighs geographic proximity for consumers seeking reliable service.
- Identify failed electronic component.
- Install replacement hardware unit.
- Perform flexible calibration via OEM interface.
Economic headwinds rarely suppress this specific segment because safety systems remain non-optional for registered vehicles. The shift toward specialized repairs insulates qualified providers from broader discounting trends seen in commodity maintenance. Independent operators must invest continuously in training to capture this expanding revenue stream before consolidation accelerates.
Mechanics: Light-Duty Aftermarket Projections Versus Total Auto Care Industry Growth Trajectories
Total industry expansion reaches a solid pace in 2026, outpacing the light-duty segment's 5.2% rate through commercial heavy-duty acceleration. This divergence indicates that non-passenger sectors absorb volatility improved than consumer-dependent repair channels. Heavy equipment and fleet maintenance buffers stabilize revenue when personal vehicle spending tightens. Commercial sectors demand higher-value parts per unit, widening the revenue gap despite lower unit volumes. Operators focusing solely on passenger cars miss the margin density found in medium-duty logistics fleets.
Pre-pandemic performance relied on volume throughput, whereas post-pandemic economics favor high-complexity, low-volume repairs. Economic headwinds compress discretionary spending but cannot defer safety-critical maintenance on aging assets. Diversification into commercial servicing mitigates the risk of consumer pullback during recessions.
Strategic Planning Using Aftermarket Forecast Data
Defining Strategic Agility Amid Geopolitical Uncertainty
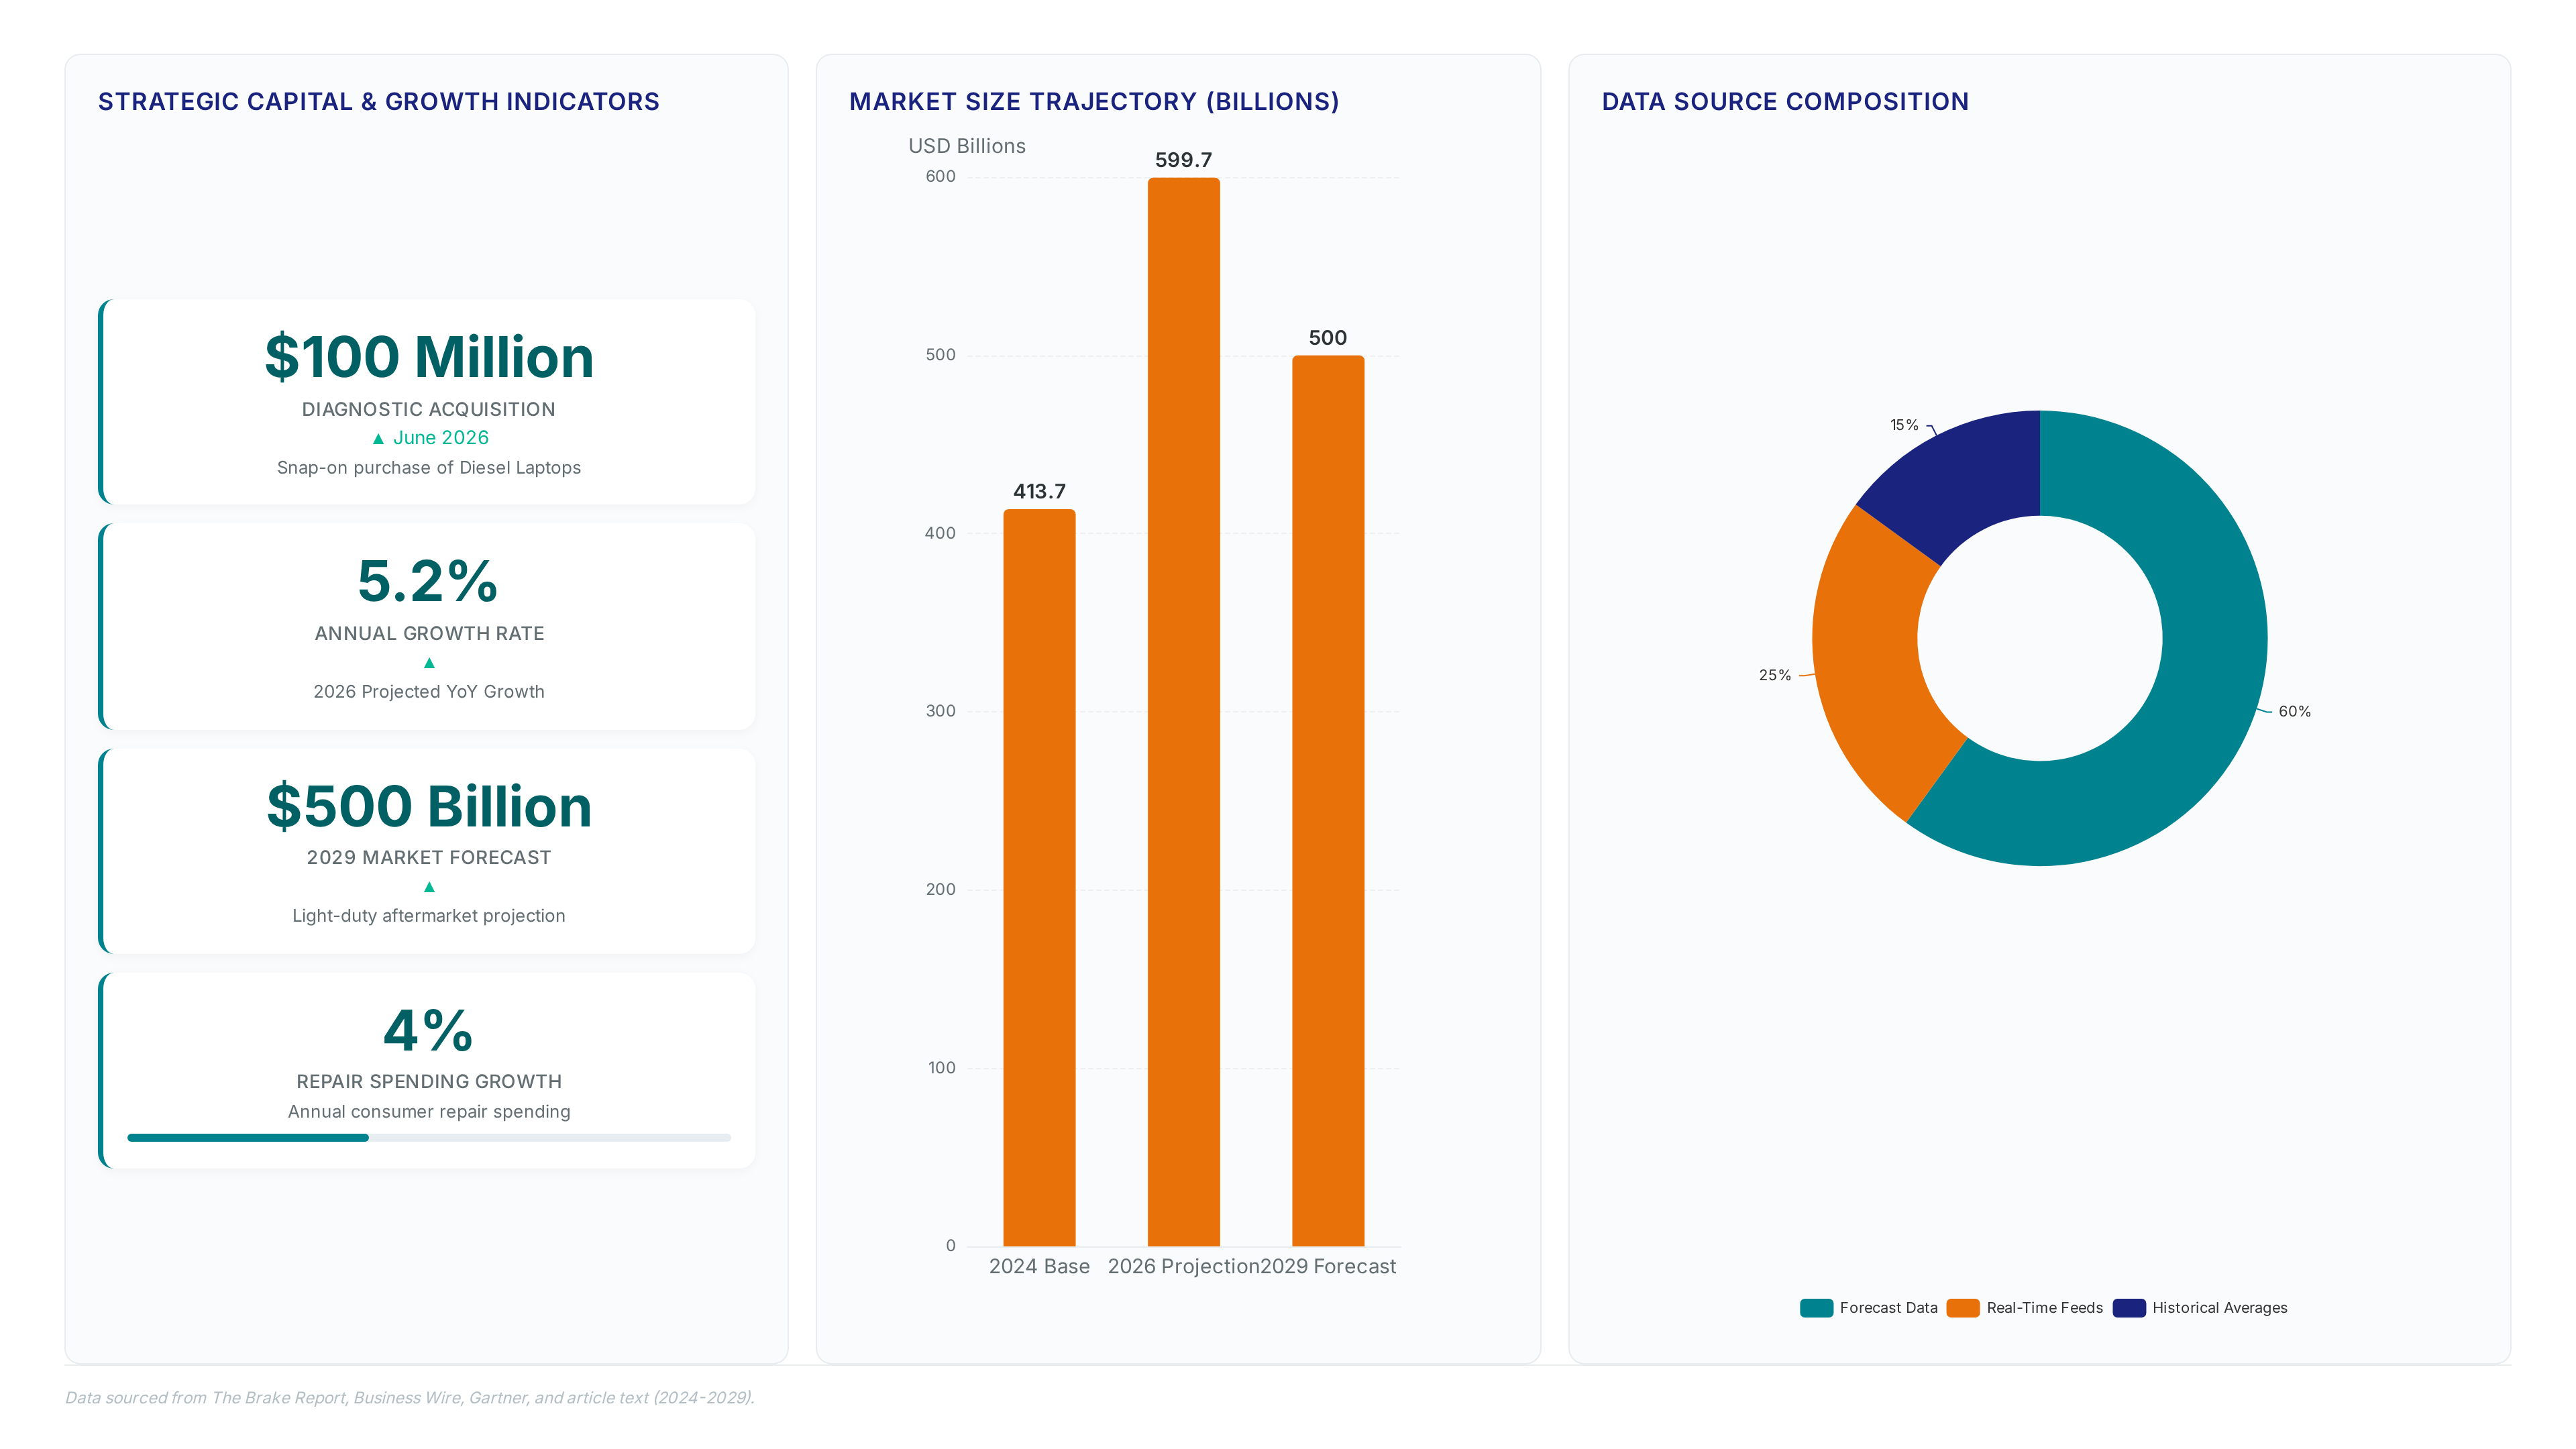
Gartner identifies unpredictability gartner.com/en/documents/7282330) as the defining theme for 2026 automotive CIOs, demanding adaptive frameworks over rigid planning cycles. Static forecasts fail when geopolitical instability alters supply chains overnight, forcing operators to prioritize speed in decision-making. Traditional models stumble because they cannot absorb sudden external shocks without manual recalibration. Strategic agility requires shifting capital from fixed assets to computational infrastructure that accelerates response times. Ford uses Nvidia GPUs to reduce design latency, a method applicable to aftermarket inventory modeling under duress. This approach contrasts sharply with annual budgeting rituals that lock firms into obsolete assumptions. Dependency on real-time data feeds replaces reliance on historical averages. Operators ignoring this shift risk obsolescence as competitors use AI agents to navigate volatility. Future durability depends on architectural flexibility, not revenue projections.
Matching technician skill acquisition to the rising complexity of sensor arrays links forecast data to revenue. Shops ignoring this alignment face obsolescence as simple part swaps evolve into software-dependent procedures requiring proprietary initialization. The barrier to entry remains high. Snapon Incorporated paid approximately $100 million for Diesel Laptops on June 8, 2026, signaling intense consolidation in the diagnostic data sector. This acquisition cost reflects the premium placed on accessing verified repair protocols that independent providers struggle to aggregate. Facilities investing now in calibration equipment capture high-margin labor, while generalists retain only commoditized maintenance. Waiting for explicit customer requests often means missing the initial wave of recurring revenue from advanced safety system maintenance.
Navigating Right to Repair Legislation and Consolidation Risks
Legislative focus on vehicle data access and aggressive private equity consolidation reshaping shop ownership create immediate exposure for investors. The Auto Care Association' actively issues statements to influence 2026 policy, signaling that diagnostic lockdown by OEMs remains a primary friction point for independent operators. Regulatory volatility intersects with a structural shift where the competitive environment moves away from fragmented models toward consolidated entities backed by significant capital.
A substantial tension exists between OEM-controlled software gateways and independent repair shops, creating a bifurcated market for those lacking equitable data rights. Firms without proprietary data access risk obsolescence as repairs become increasingly software-dependent. The surge in private equity involvement introduces execution risk, as aggressive rollup strategies often prioritize financial engineering over technical integration of diverse shop cultures. Operators must verify that their partners possess not capital, but the technical agility to navigate evolving Right to Repair mandates. Failure to align with entities capable of managing both legislative compliance and data interoperability will likely result in margin compression. Strategic capital deployment now requires dual due diligence on legal standing and software compatibility rather than simple revenue multiples.
Navigating Economic Headwinds and Repair Complexity Risks
Defining Economic Headwards and Repair Complexity Risks

Gartner identifies agility as the primary requirement for automotive CIOs facing rapid technological shifts in 2026. This instability stems from macroeconomic volatility colliding with technical barriers created by rising vehicle complexity. Pre-pandemic performance models relied on steady repair cycles. Post-pandemic dynamics force operators to navigate a fragmented environment where simple part swaps are increasingly rare. Advanced driver assistance systems create a specific technical choke point known as diagnostic lockdown. Vehicles remain unrepairable outside dealer networks without proper authorization. This reality effectively shrinks the addressable market for non-franchise operators.
Hidden costs associated with this complexity include:
- Mandatory investment in proprietary diagnostic tools that require frequent, costly updates.
- Increased labor hours spent troubleshooting software conflicts rather than replacing mechanical components.
- Revenue loss from turning away vehicles due to lack of specific OEM certifications.
- Stranded capital when equipment cannot process new model year protocols.
Legislative focus on Right to Repair creates friction between maintaining fleet uptime and adhering to OEM security protocols that limit third-party intervention. Products and Brands must prioritize adaptive frameworks over rigid planning to survive this transitional period where technical barriers outweigh traditional economic headwinds. The mechanism driving this urgency involves the transition from mechanical replacement to software-dependent initialization. Missed sensor alignment triggers immediate system faults. Operators referencing diagnostic tools data recognize that revenue per repair order increases only when technicians possess certified competence in handling these complex arrays. A significant barrier exists because the diagnostic lockdown imposed by OEMs restricts independent access to proprietary gateways required for full system resets.
Shops investing in hardware often lack the legal data rights to complete jobs. The structural conflict manifests in several ways:
- Mandatory annual subscription fees for OEM cloud access.
- Extended vehicle dwell times during software handshake failures.
- Liability exposure from incomplete ADAS recalibration procedures.
- Rapid obsolescence of static alignment racks unable to handle flexible targets.
- Inability to resell specialized hardware after OEM credential revocation.
Meanwhile, shops ignoring these variables face stranded assets despite rising market volume. Strategic planning requires verifying data access policies before purchasing calibration equipment. Products and Brands offers updated inventory lists that account for these legislative and technical constraints. This transaction creates a diagnostic lockdown where independent shops lose access to critical repair data unless they pay premium fees to consolidated tool providers. A structural tension exists between OEM-controlled software gateways and independent operators who require equitable data rights to service modern vehicles effectively. Autocare.org/news/latest-news/details/2026/05/21/ actively issues statements to influence 2026 policy, yet legislative outcomes remain uncertain for small businesses lacking lobbying resources.
Hidden costs emerge for investors evaluating whether they should invest in the automotive aftermarket without accounting for these access restrictions:
- Proprietary software licensing fees increase operational overhead beyond traditional parts margins.
- Technician training cycles lengthen as manufacturers fragment diagnostic procedures across incompatible platforms.
- Asset depreciation accelerates when OEMs revoke digital credentials for third-party scanning equipment.
- Reduced resale value for shops dependent on single-source diagnostic ecosystems.
- Legal expenses related to compliance audits and data usage disputes.
The vehicleservicepros. Com Private equity seeks scale to negotiate data access. Purely independent entities face marginalization. Growth projections assume open competition. Consolidation creates gatekeepers who control the digital keys to the aftermarket system. Investors must verify data access clauses in acquisition targets before committing capital. Solutions for navigating these channel conflicts are available through Products and Brands. The path forward demands clear-eyed assessment of technical dependencies alongside financial metrics.
About
Dmitry Volkov serves as a Senior Automotive Technical Writer at KZMALL Auto Parts, where he specializes in translating complex engineering data into actionable industry insights. His daily work involves analyzing precise ACES/PIES fitment data and evaluating over 50,000 SKUs across KZMALL's proprietary brands, giving him a unique vantage point on market dynamics. By managing technical documentation for a global B2B platform serving the independent aftermarket, Volkov observes real-time shifts in demand for non-warranty components and service labor. His role at KZMALL, a key supplier to the very distribution channels driving this expansion, ensures his perspective is grounded in the operational realities facing wholesalers and retailers today. This practical expertise allows him to accurately contextualize broad economic forecasts against the specific needs of professional technicians and parts distributors.
Conclusion
The current growth trajectory masks a critical breaking point: operational fragility when software gateways restrict service volume. While revenue climbs, the margin erosion from proprietary licensing and fragmented diagnostic training creates a hidden tax on scalability that pure financial models ignore. Shops relying on legacy independence without digital use will find their asset values compressing as OEMs revoke credentials arbitrarily. The market does not punish smallness; it punishes digital dependency without contractual protection.
Investors and shop owners must mandate a data access audit for any acquisition or expansion plan by Q3 2026. Do not assume historical repair volumes guarantee future throughput when the software layer can be throttled remotely. The window to negotiate multi-year, portable data rights before further consolidation locks these terms is closing rapidly. Prioritize partners with open-architecture diagnostics over those offering merely low-cost parts.
Start this week by inventorying every diagnostic tool in your fleet and mapping its specific OEM dependency chain. Identify which scanners lose functionality if a subscription lapses or a manufacturer changes its API protocol. This immediate visibility reveals your true exposure to external control improved than any revenue forecast. Secure your operational continuity by diversifying your digital toolkit before the next software update cycle enforces stricter vendor lock-in.
Frequently Asked Questions
Sales grew significantly to reach a massive valuation last year. The sector expanded by 5.7% in 2024 to reach $413.7 billion, excluding warranty work while focusing on consumer-driven maintenance demands.
The market is on a clear path to reach this major milestone soon. Industry trajectories indicate the sector will surpass $500 billion by 2029, extending post-pandemic growth patterns effectively.
This specific sector holds substantial value within the broader automotive repair landscape. Recent data places the replacement tire market value at $57.7 billion in 2024, driven by aging vehicle fleets.
The sector expects steady expansion fueled by older vehicles needing repairs. The industry projects a 5.2 per cent expansion in 2026, fueled by shifts toward professional service labor and parts.
Drivers prioritize safety and cost savings over acquiring brand new transportation units. This behavior pushes the replacement tire market value to $57.7 billion in 2024 as cars stay on roads longer.